Search this blog for other interesting articles

Tuesday, 30 August 2011

How to search notes in SAP service Market Place ?

This article answers the following queries :

  • How to search notes in SAP service Market Place ?
  • How to download notes from SAP service market place?
--------------------------------------------------------------
1)   Please login to SAP service market place as below :
      Type the following link on any browser
It opens a page similar to below screen and prompts to enter your market place credentials. you have to enter your s-user id and password and authenticate yourselves.


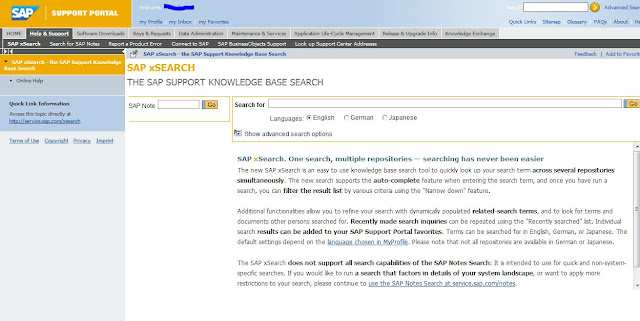
2)      Afterwards navigate to Help & Support  -> Search for SAP notes as shown in the below screen


3)      In the SAP Notes search screen,  in case you already know the note number, you can directly enter the note number in the box provided (highlighted) and press enter which  opens up the note number mentioned.


4)      Incase you donot know any specific note, you can do note search using key words.
In the example am searching notes with keywords “java is not coming up”.
It displays screen as shown below with the relevant notes. From those notes you can select the notes that are relevant for your problem and the system.


5)      To open any note from the displayed list, simply double click on that links that are displayed which opens the note as shown below


Click on the PDF pusbutton in the opened note to download the note in PDF format


Types of RFC communication

This article answers the following queries:

  • What are the different RFC communication types in SAP?
  • What is the difference between Synchronous and Asynchronous RFC types?
  • What is the RFC communication type in which all requests are processed in order they are received?
  • What is the difference between Transactional RFC and Queued RFC?
  • What is/are the RFC types in which remote system is not required to be     available at the moment the RFC client program start the call?
  • In what scenarios, Queued RFC type can be used?
----------------------------------------------------------------------------------------
There are mainly 4 types of RFC communication in SAP. They are

  • Synchronous RFC
  • Asynchronous RFC
  • Transactional RFC
  • Queued RFC

Synchronous RFC (sRFC) :  In this type of RFC communication, the calling program waits until the requested processing step on the remote system has ended and then continues to work locally.
In other words, both the systems involved must be available at the time the call is made.

Asynchronous RFC (aRFC) : In this type of RFC communication, the calling program gives the request to the remote system and immediately continues to work locally. The requested processing step is executed on the remote system in isolation.
If the remote system cannot be reached at the time of the call, the asynchronous calls of the RFC client are lost

Transactional RFC (tRFC) : This type of RFC communication is similar to asynchronous RFC but by allocating a transaction id(TID)  it guarantees  that if a request is sent several times because of network problems  it is processed only once. Unlike asynchronous RFC,  in Transactional RFC the remote system does not have to be available at the moment the RFC client program start the call. The data is held in the source system until the target system is available.
The report program RSARFCSE is called in the background at regular intervals and tries to place the unsuccessful requests, identified by their transaction id again.

Queued RFC (qRFC) : This RFC communication is an extension to the transactional RFC. In this method, all the requests are queued up(inbound queue and outbound queue) and are processed in a sequence only if it is certain that all preceding calls are processed correctly. This method guarantees that all the requests are processed in the sequence in which they are received.
This type of RFCs will be used in SCM (APO) systems for CIF queues etc where requests have to be processed in an order.


Related Links :


<

Monday, 29 August 2011

SAP User Types


This article answers the following queries:

  • What are the different user types in SAP?
  • Which user type(s) is /are used for dialog free communication in SAP?
  • Validity period of a password is not applicable to which user type(s) in SAP?
  • What are the specific uses of system user type in SAP?
  • Which user type(s) cannot be used for direct logon to the SAP system?
  • Which user type in SAP does not have a check on validity of password expiry or initial password?
  • Which user type in SAP can be used to assign additional identical authorizations to other users?

--------------------------------------------------------------------

These are the 5 user types that are present in SAP

  • Dialog
  • Communication
  • System
  • Service
  • Reference

Dialog:  This is the most commonly used type. This user type is primarily for individuals to gain interactive system access.  A user of this type can perform dialog processing in interactive mode, background processing, batch input processing and CPI-C services provided there are no explicit restrictions via assignment of specific authorizations.
SAP licensing can prohibit multiple concurrent use of the same user id in production SAP systems.

Communication:  This user type is used for dialog-free communication between systems such as RFC (Remote Function call) communication. This user is not allowed to logon to the R/3 system or start dialog processing

System: This is the user type which can be used for dialog-free communication within a system (such as for RFC users for ALE, TMS, workflow and CUA) and for background processing.
A specific use of the system user type is validity period of a password won’t apply for this type. So, this can be used to run background jobs and in between RFCs so that jobs or RFC communications won’t fail due to expiry of the password.
Please note that logon in dialog is not possible used System user type.

Service: This user type is a dialog user which is available to a large, anonymous group of users. For example, to access via ITS (Internet Transaction Server)
There won’t be any check on initial password or expired passwords for this user type. Also, multiple logons are explicitly permitted for this user type.
However this user type should be assigned with great caution and with limited authorizations for security reasons.

Reference:  This user type is in general, non-person related user.  This user type cannot be used for logon. Instead this user type will serve as a reference for assigning additional identical authorizations to other users.
For example: In case you have to assign some identical authorizations to all internet users, you can create a reference user with those authorizations and use this reference user to assign identical authorizations to all other users.


Friday, 26 August 2011

SAP Java Monitoring Check list 2

This article is in continuation with the below article :


--------------------------------------------------------------------
To check “Logs and Traces”, navigate to System Management -> Monitoring -> Logs and Traces
From the drop down box, different logs can be checked


Process list – List of processes that are currently running can  be viewed here and any long running process can be identified and actioned accordingly.


Using Management Console for monitoring Java System :
To open management console for SAP systems based on Unix operating system, add 13 for the port of the portal as mentioned below

A screen similar to below screen will appear :


You can drill down further on SID of the system to view database,Central and SCS instance details as below :


Please note that Management Console can be accessed even when java is down for a sap system.
You can check database status as below :


You can check the javanode status as below:

Status should be running here if java is up


Process list – List of processes that are currently running can  be viewed here and any long running process can be identified and actioned accordingly.


SDM, Dispatcher, Server0 and server1 node status can be checked here:


Various work directory logs, availability log, application log and default trace can be checked here :


Availability log :


Sapstart log:


Dev_jcontrol log :


Dev_server0 log :


To check the status of message and enqueue servers, check the process list under scs instance as mentioned below :


To check various logs related to message server, enqueue server, jcmon check the logs under SCS instance as mentioned below :


Related Link :
Live Cache Monitoring in SAP


SAP Profiles

This article answers the following queries:

  • What are SAP Profiles? Why are they needed?
  • What are the different types of SAP Profiles and their significance?
  • What is the path of profile directory in SAP?
  • What is the location of profiles in SAP?
  • Which SAP profile is used to define system wide settings?
  • What are the contents of Default profile ( DEFAULT.PFL), Start Profile and Instance Profiles ?
  • What are the naming conventions of various SAP Profiles?
  • If instance profile is modified, what needs to be done for the changes to take effect?
  • If default profile is modified, what needs to be done for the changes to take effect?
  • What is the significance of cdpro command in SAP related to AIX or HPUX Operating systems?
  • If an instance profile is modified is it required to restart entire SAP system?
  • What is the sequence in which SAP profiles are read by the SAP system?
  • If some value is set for a parameter in default profile and in instance profile another value is set for an instance. For that instance which value will take precedence? Is it default profile value or instance profile value?
  • What is the sap parameter that is used to set the profiles path in an SAP system? In which profile it would be set?

----------------------------------------------------------------------------------------
SAP R/3 systems uses  Profiles  to define the properties of an SAP R/3 Instance such as the type and number of work processes, the size of main memory reserved for SAP R/3 and various parameters like multiple logon, idle time out value etc
There are 3 types of profiles in SAP.
They are


  • DEFAULT.PFL (known as System Profile)
  • Start Profile
  • Instance Profile

All the profiles mentioned above are stored in the profile directory defined during installation of the SAP system.
This path can be set using DIR_PROFILE profile parameter in the start profile.
Ideally the path of profile directory would be
In Unix Systems :
/usr/sap/<SID>/SYS/profile or /sapmnt/<SID>/profile
In Windows NT :
\\<SAPGLOBALHOST>\sapmnt\<SID>\sys\profile

Tip: Please note in AIX or HP-UX environment, we can go to the above profile directory  
              location using cdpro command at Os level.

All instances of a SAP system can read these profiles with share ( Systems based on Windows ) or mount (Systems based on Unix) technology.
DEFAULT.PFL :  This profile exists uniquely in an SAP R/3 system. It means if there are 5 application servers in an SAP system, even then there will be only one DEFAULT.PFL file.
 It contains system-wide settings which include

  • Name of the SAP system
  • The database system
  • Name of the enqueue server
Each SAP R/3 instance to be started reads this profile first. The information specified in this profile is very vital for the functioning of the SAP system.

START PROFILE :   Unlike default profile, the start profile is specific to an instance. It means if there are 5 application servers each will have one separate start profile with the settings specific to an instance.
The startup process of the SAP system is controlled by the start profile that is read by the start program [sapstart]. Here the services(eg: message, gateway, dialog , batch etc) that are to be started are listed. Hence every instance will have separate start profile.
In other words, the start profile determines how, where and under what name individual SAP R/3 services and processes are to start.
The naming convention of START PROFILE will be as below :
START_<instance><instance_number>_<host_name>
Eg: START_DVEBMGS00_prdserv4
For the start profile default names are assigned during the installation of an instance based on the services that are running on the instance. For example, DVEBMGS in the start profile above confirms that following services are available for that instance.
D – Dialog
V – Update
E – Enqueue
B – Batch
M – Message
G – Gateway
S -  Spool

INSTANCE PROFILE :   Like start profile, Instance profile is specific to an instance. It means if there are 5 application servers each will have one separate start profile with the settings specific to an instance.
 The runtime environment of the instance is configured in the instance profile.  In instance profile parameters specific to an instance can  be set like auto gui logout time(rdisp/gui_auto_logout), number of various workprocesses (rdisp/wp_no_dia),  memory related parameters like abap/buffer_size, em/initial_size_MB, rdisp/PG_SHM, rdisp/ROLL_SHM etc
The naming convention for the instance profile will be as below :
<SID>_<instance><instance_number>_<hostname>
Eg :  SQ1_DVEMBSG00_prdsapk1

During the installation of an SAP R/3 system, the profiles are created with standard values. Later it  is Basis administrator’s responsibility to tune the parameters.
The source code of the SAP Kernel already sets standard default values for most of the system parameters. However, you must specify some specific details like computer name, system name and distribution of resources in the profiles.
The SAP profiles are read during the startup of an instance. The values defined in the system profile (ie. DEFAULT.PFL) overwrite the standard settings in the source code. The values defined in the instance profile overwrites the parameter values of DEFAULT.PFL for the instance.

In case of any changes to System Profile ( DEFAULT.PFL or Default Profile), you must restart all the instances of the SAP system as this is common for all instances.
However in case of any changes to instance profile, it is sufficient to take restart of only that particular instance for the changes to take effect.

Sequence of SAP profiles that are read while starting SAP system :
  • First start profiles of various instances are read by the sapstart program
  • Secondly Default profile is read
  • Finally, instance profiles of various instances are read.


Related Links :


Thursday, 25 August 2011

SAP Java monitoring Check list

This article answers the following queries :

 
 Ã˜  How to perform daily monitoring of Java stack in SAP ?

Ø  What are the daily checks for Java applications of SAP ?

Ø  How to access management console in SAP ?

Ø  How to perform session monitoring in JAVA stack  of SAP ?

Ø  How to view various java reports in JAVA stack of SAP?

Ø  What are the various java reports available in Java stack of SAP  and what is their significance?

Ø  How to view log and traces in java stack of SAP?

Ø  Where to view default trace in java stack of SAP?

Ø  What is the use of  management console in SAP ?


-----------------------------------------------------------------------------------------

JAVA Monitoring

Contents :

1.       Checking the java stack/portal accessibility

2.       Actioning, in case portal not accessible

3.       User load analysis

4.       Java Reports – Navigation and usability

5.       Memory consumption and Threads report

6.       Session Monitoring

7.       Logs and Traces (Default trace, Server0 log etc)

8.       Accessing Management Console

9.       Checking System availability using Management Console(SDM, Msg server, Enqueue server, Java nodes etc)

10.   Check various logs(work directory logs, jcontrol, default trace, application log etc)

Java Monitoring :

Place the link of the respective java application in the browser and check whether the java application is opening:
For example:

If java is up and running, a screen similar to below will open.


If the page did not open,
i)  Check  whether there are network issues
ii) Check tablespaces occupancy levels at Oslevel and make sure sufficient 
    space is there and  if any tablespace is  100% full, action the same
iii) Check the default trace for any critical errors
iv) Check application log to determine any memory related issues
v)  Check server node status at oslevel or through management console and 
     action and bring up the java again.
To estimate the user load and to check the number of users logged onto the java portal :
Navigate to User Administration ->  Activity Reports

i)   Check “Number of users in the last 3 hours” report


   ii)   To figure out most active users, check the 10Most active users report


Java Reports :

Java Memory Consumption Report and Threads Reports :
These reports includes a chart of the memory usage of a cluster node and a chart related to the system and application thread pool.
To check this report login to nwa of the respective java stack :


Then  navigate to Monitoring -> Java System Reports :

Here following reports can be taken by selecting the respective report from the drop down provided:


ü  Capacity Planning : This report includes a chart representing the requests sent to J2EE Engine, a chart for the number of http and security sessions, and a chart of the communication between J2EE nodes
ü  Resource Consumption : This report includes a chart of the memory usage of a cluster node, and a chart related to the system and application thread pool
ü  Error Statistics:  This report includes a chart representing a collection of counters useful for investigating problems. There are also charts that give an overview of timeouts and the size of log files

ü  Application Activities : This report includes a chart that represents the history of the activities of deployed applications

  •        Slowest requests in detail
  •        Slowest requests
  •        Slowest components
  •        User activities
  •        Current activities
  •        Monitor Browser


However from monitoring perspective, resource consumption report is most important to analyse the memory consumption.

Select resource consumption from the dropdown to view the memory statistics as below:


Click on Go to Detailed Chart link of the respective report to view detailed chart as below


Click Hint on charts link to analyse the report better.


Select the respective Instance, Cluster node and Time period from the provided dropdown boxes to view the reports belonging to the same


Table view for Threads report:


There are 2 types of views: Chart view and Table view. You can change the view by selecting the respective radio button.
Please find below table view for Memory Consumption report


Session Monitoring:
To monitor sessions, navigate to Monitoring -> Session Monitoring


LiveCache Monitoring


Search this blog for other interesting articles

Please subscribe & activate link received to your email id to receive latest articles

Enter your email address:

Delivered by FeedBurner